Force Motors’ 3-year, 14x run: Is the commercial vehicle cycle turning, or has the stock run ahead? | Smart Stocks News

In India’s commercial vehicle industry, Force Motors occupies a lane of its own. It is neither a high-volume mass manufacturer nor a pure-play auto component supplier. Instead, it straddles two worlds that rarely overlap.
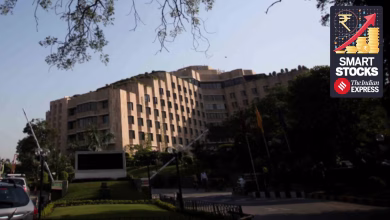
On one side is its near-monopoly in niche commercial vehicles. The Traveller van, ubiquitous as ambulances, school buses, and corporate shuttles, commands an estimated 70–75% market share.
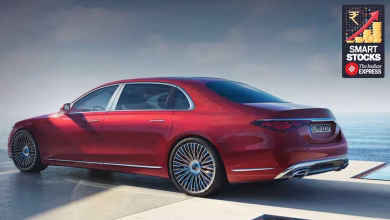
On the other is a quieter, precision-driven business: manufacturing engines and axles exclusively for BMW and Mercedes-Benz from dedicated plants.
This dual identity — commercial workhorse by day, luxury OEM supplier by night — makes Force Motors one of the most unusual plays in Indian automotive manufacturing.
 Source: http://www.tradingview.com
From a loss of Rs 91 crore in FY22, the company reported a profit of Rs 801 crore in FY25.
The stock mirrored this shift, rising from around Rs 1,500 in early 2022 to a peak of Rs 21,900 in August 2025 before settling near Rs 20,700. The question now is not whether Force Motors has turned around, but whether the next phase can justify the valuation it commands.
Inside Force Motors’ operating DNA
Founded in 1958 by NK Firodia and now led by Dr Abhay Firodia, Force Motors has always taken the road less travelled. Unlike most vehicle manufacturers, it is deeply vertically integrated, producing engines, gearboxes, and axles in-house, supported by one of India’s largest automotive tool rooms.
Its vehicle portfolio is deliberately niche-focused:
Story continues below this ad
1. Traveller, its flagship offering, remains the backbone of ambulances and staff transport.
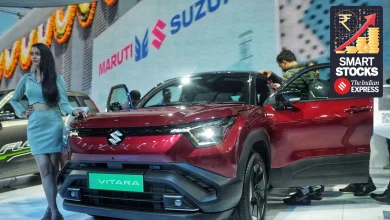
2. Urbania, its newer monocoque-based premium van, targets corporate mobility and high-end tourism, a segment Force Motors is attempting to create rather than compete in.
3. The rugged Trax caters to rural and utility applications
4. The iconic Gurkha has evolved into a niche off-road vehicle with both civilian and defence relevance, with the company receiving a landmark order for 2,978 Light Strike Vehicles for the Indian Army and Air Force.
 Source: Force Motors Investor presentation
This focus is clearly reflected in the company’s revenue mix.
Story continues below this ad
Segment-wise revenue mix
Over the last three years, commercial vehicles have steadily increased their share of sales, rising from 48% in FY23 to around 55% in FY24 and FY25, driven by recovery in mobility-led demand and improving realisations.
At the same time, the contribution from motor vehicle engines has remained reasonably stable at around one-third of revenues, highlighting the annuity-like nature of the component business.
 Source: Force Motors Investor presentation
Smaller segments, such as parts and accessories, contribute roughly 7%. The company also made a strategic decision to exit its agri-tractor business in March 2024.
The second engine of growth lies in components.
At its Chennai facility, Force Motors manufactures engines and cooling modules for every BMW vehicle produced in India, crossing the 100,000-engine milestone in June 2025.
Story continues below this ad
A separate plant in Chakan supplies engines and axles to Mercedes-Benz, with over 150,000 engines and 140,000 axles delivered to date. A 51:49 joint venture with Rolls-Royce Power Systems produces Series 1600 engines for global power generation and rail applications, the only facility of its kind worldwide.
When the cycle turned
Light commercial vehicles are inherently cyclical, tied closely to infrastructure activity, replacement demand, and mobility trends. The pandemic years were particularly punishing, pushing Force Motors into losses by FY22.
The recovery since then has been powered by multiple tailwinds. Shared mobility rebounded sharply, benefiting Traveller and Urbania, a segment in which it is the market leader with 70-75% market share. Healthcare logistics also expanded structurally, reinforcing ambulance demand. Meanwhile, luxury OEMs increased localisation, directly lifting engine volumes.
Policy also played a role. The gradual reduction of GST on commercial vehicles from 28% to 18% is expected to unlock deferred fleet replacement, a trigger highlighted by several analysts, including SBI Securities. While not immediate, it improves long-term demand visibility.
Story continues below this ad
The transformation story: From red to record black
The turnaround is evident not just in numbers, but in quality.
 Source: Force Motors Investor Presentation
Operating profit margins expanded from 13% in FY24 to 14% in FY25, touching 14% in Q1 FY26 and a sharp jump to 17% in Q2 FY26. This was driven by operating leverage and a richer product mix tilted toward premium offerings like Urbania and the new Gurkha.
Further, disciplined debt management reduced finance costs, benefiting the bottom line.
 Source: Force Motors Investor Presentation
Return on capital employed rose from 30% in FY24 to 30% in FY25.
Story continues below this ad
Force Motors is now effectively debt-free, with borrowings declining from Rs 1,069 crore in FY22 to just Rs 17 crore in FY25. Annual operating cash flows remain strong, comfortably funding planned capex of Rs 400-500 crore without external borrowing.
Risks beneath the hood
Despite the strength, risks remain. Commercial vehicles remain cyclical by nature. Any slowdown in infrastructure spending or shared mobility could hit volumes. Raw material costs — steel, aluminium, tyres — account for over half of revenues and pose margin risks.
The component business, while stable, is concentrated. A slowdown in BMW or Mercedes-Benz India production would flow directly to Force Motors. Regulatory uncertainty around diesel vehicles and unfavourable taxation for certain van categories also persist, though EV options are under development.
What the market is paying for
Revenue grew from Rs 3,240 crore in FY22 to Rs 8,072 crore in FY25, while profits swung decisively into the black. Momentum continued into H1 FY26, supported by strong vehicle volumes and execution of state government and defence orders, including a large ambulance contract from Uttar Pradesh.
Story continues below this ad
 Source: Force Motors Investor Presentation
GST rationalisation: A strategic catalyst
While replacement demand initially sparked a recovery for Force Motors, the recent GST rationalisation has become the primary driver of near-term growth.
By correcting a long-standing tax anomaly, the government reduced the effective tax on 10-13 seater vehicles from ~43% (including cess) to a significantly lower rate, representing an effective ~25% tax reduction.
This has significantly boosted affordability, releasing years of deferred demand in staff transport, tourism, education, and healthcare.
Following a brief post-announcement lull, CRISIL data confirms a sharp October rebound, with wholesale offtake up 17% and retail sales rising 11.5%, converting latent interest into tangible volume growth.
Story continues below this ad
This recovery is evident in Force Motors’ Q3 FY26 business update, where vehicle sales increased nearly 50% year-over-year to 3,048 units, with domestic volumes up 48.7% and exports growing over 88% from a low base.
Management described H1 FY26 as the strongest first half in the company’s history, driven by broad-based demand across ambulances, staff transport, tourism and utility applications, segments that, as previously mentioned, had seen prolonged deferment in replacement cycles.
Product mix change and operating leverage
Product mix has further amplified this operating leverage. The Urbania platform, positioned in the Rs 35-40 lakh range versus Rs 10-15 lakh for the older Traveller, has reached a steady-state run rate of ~600 vehicles per month, supported by exports across GCC markets and Latin America. Alongside this, execution of the ~3,000-vehicle Light Strike Vehicle defence order has begun, adding medium-term revenue visibility.
Beyond near-term deliveries, management has articulated a more ambitious goal: positioning Force Motors among the world’s top 10 van manufacturers over time.
Importantly, this operating momentum is being underwritten by cash, not leverage. CRISIL noted that Force Motors is expected to maintain healthy operating cash flows over the medium term, supported by improving profitability, stable working capital intensity, and a conservative capex plan.
Annual cash accruals are projected to remain comfortably above planned capital expenditure, allowing the company to fund growth internally while retaining a near-zero debt profile.
 Source: Force Motors Investor Presentation
Valuations
Force Motors’ story is compelling. However, the valuation already reflects much of this optimism. At 33x earnings, investors are paying for perfection, betting that cyclical tailwinds persist, margins sustain at elevated levels, and the premium product mix continues to drive realisations.
 Source: http://www.screener.in
Even based on EV/EBITDA, valuations are well above the median of 14.2x.
 Source: http://www.screener.in
From a value investing standpoint, Force Motors is a case study, meant to be studied so future opportunities similar to this one are not missed. For the growth investor, the bet is that the company will continue to deliver growth at a similar pace, even if from an already priced multiple.
Note: We have relied on data from http://www.Screener.in and http://www.tijorifinance.com throughout this article. Only in cases where the data was not available, have we used an alternate, but widely used and accepted source of information.
Rahul Rao has helped conduct financial literacy programmes for over 1,50,000 investors. He has also worked at an AIF, focusing on small and mid-cap opportunities.
Disclosure: The writer or his dependents do not hold shares in the securities/stocks/bonds discussed in the article.
The website managers, its employee(s), and contributors/writers/authors of articles have or may have an outstanding buy or sell position or holding in the securities, options on securities or other related investments of issuers and/or companies discussed therein. The content of the articles and the interpretation of data are solely the personal views of the contributors/ writers/authors. Investors must make their own investment decisions based on their specific objectives, resources and only after consulting such independent advisors as may be necessary.