
From losses to 27% EBITDA: Decoding GE Vernova’s transformation story | Smart Stocks News
At 85x earnings, the market is clearly paying a premium. The question is whether it’s paying for what has already happened, or for what’s coming next. Three factors determine the answer:
The margin transformation that took EBITDA from negative 2.7% to 27% in four years, and whether it can sustain as the revenue mix shifts towards HVDC projects.
The HVDC breakthrough with a pipeline of 4+ projects backed by Rs 9 lakh crore of planned transmission investment through 2032.
The valuation math at 85x PE and 45x book, and whether the growth trajectory justifies it. Let’s dig in.
|
Metric |
FY23 |
FY24 |
FY25 |
9M FY26 |
YoY (9M) |
|
Revenue (Rs Cr) |
2,773 |
3,168 |
4,292 |
4,569 |
+46% |
|
EBITDA (Rs Cr) |
80 |
319 |
819 |
1,239 |
+119% |
|
EBITDA Margin |
2.7% |
10.1% |
19.1% |
27.1% |
+910 bps |
|
PAT (Rs Cr) |
-2 |
181 |
608 |
882 |
+109% |
|
Order Backlog (Rs Cr) |
3,700 |
6,273 |
12,658 |
14,384 |
+14% QoQ |
|
Cash (Rs Cr) |
– |
280 |
1,050 |
1,585 |
Debt-free |
Source: GE Vernova T&D India IPs (Q4 FY25 to Q3 FY26), AR FY25. (All figures in Rs crore)
Revenue has increased from Rs 2,773 crore in FY23 to a 9-month run rate that annualises to over Rs 6,000 crore.
PAT has swung from a Rs 2 crore loss to Rs 882 crore in just nine months of FY26. The order backlog has quadrupled from Rs 3,700 crore to Rs 14,384 crore in three years, and the company is sitting on Rs 1,585 crore of cash with zero debt.
Story continues below this ad
But the headline numbers only tell part of the story. Margins have driven the rerating.
The margin transformation
In FY22, GE Vernova T&D India posted an EBITDA margin of -2.7%. Revenue was shrinking, and the order backlog fell to Rs 3,723 crore.
The company was losing money on the projects it was executing because many of those orders had been booked at thin or negative margins during a prolonged industry downturn.
Four years later, the 9-month EBITDA margin stands at 27.1%, a 3,200 basis point swing.
Three forces drove this transformation.
- Operating leverage: Revenue grew 35% in FY25 and 46% in 9M FY26, while employee costs and other expenses grew far more slowly. Management maintained tight control over fixed costs, and the incremental revenue dropped almost entirely to the bottom line.
- Pricing discipline and backlog quality: In FY23, management adopted a strategy of “product over project” and “cash over revenue.” They deliberately avoided low-margin turnkey contracts, focused on higher-margin product orders (transformers, GIS, AIS), and built the backlog through disciplined underwriting. As old, poorly-priced orders phased out, the margin on the remaining backlog improved steadily.
- The export mix: Exports grew from roughly 18-20% of the order backlog to about 30%. Export orders carry margins roughly 500 basis points higher than domestic orders. In Q1 FY26, when exports were 39% of revenue, EBITDA margins peaked at 29.1%.
Management’s guidance has evolved cautiously, from warning that 29% margins are not a benchmark, to settling expectations in the “mid-20s,” and most recently indicating no major near-term dilution.
The risk lies in project mix.
As the company executes more HVDC turnkey projects, typically lower margin than product sales, percentage margins may compress. Management, however, is reframing the discussion toward absolute EBITDA growth, not margins alone.
The HVDC breakthrough
If margins explain how GE Vernova T&D got to 85x, HVDC explains why the market continues to pay it.
Story continues below this ad
In Q3 FY26, the company secured a landmark order from the Adani Group for the Khavda-South Olpad project, one of India’s first VSC-based HVDC projects.
What’s more is that GE Vernova T&D India is the sole OEM and the execution timeline is approximately four years.
The order has not yet been booked in the reported order backlog because it awaits certain commercial milestones. When booked, it will expand the Rs 14,384 crore backlog.
Additionally, the Chandrapur HVDC refurbishment order from PGCIL was booked in Q3, and at least four more HVDC projects are in the pipeline.
Source: Concall commentary Q4 FY25 to Q3 FY26. Pipeline based on management guidance. *LCC – Line commuted converter (a type of HVDC technology). TBD – To be decided.
The macro tailwind is India’s renewable energy buildout. India added 38 GW of solar and 6.3 GW of wind capacity in calendar year 2025 alone. Renewable energy now accounts for roughly 50% of India’s installed power capacity. But these generation sources are concentrated in remote locations, far from consumption centres. HVDC is the most efficient technology for transmitting bulk power over long distances.
The National Electricity Plan II has approved Rs 9.2 lakh crore of transmission infrastructure investment through 2032. Peak power demand is projected to reach 446 GW by 2030, up from 250 GW today. GE Vernova is among a handful of global players, alongside Hitachi Energy and Siemens Energy, with capabilities across both LCC and VSC systems
The Rs 1,046 crore capacity bet
The company plans Rs 1,046 crore of capex between FY26 and FY29, funded entirely through internal accruals.
Source: Q4 FY25 and Q2 FY26 IPs and concall commentary
HVDC is part of a broader capacity expansion, but the most significant investment is in Vadodara, where transformer and reactor capacity are being expanded by more than 50%. Transformer deliveries in the industry currently take 18 to 24 months, while the market is seeking 10-12-month turnarounds. The GIS and AIS expansion at Hosur and Padappai adds 25% capacity, targeting both domestic Tariff-Based Competitive Bidding (TBCB) orders and export markets.
The 85x question (valuations)
At approximately Rs 3,700 per share, the stock trades at roughly 85x trailing earnings and about 47x book value. The trailing twelve-month Earnings Per Share (EPS) is approximately Rs 42.
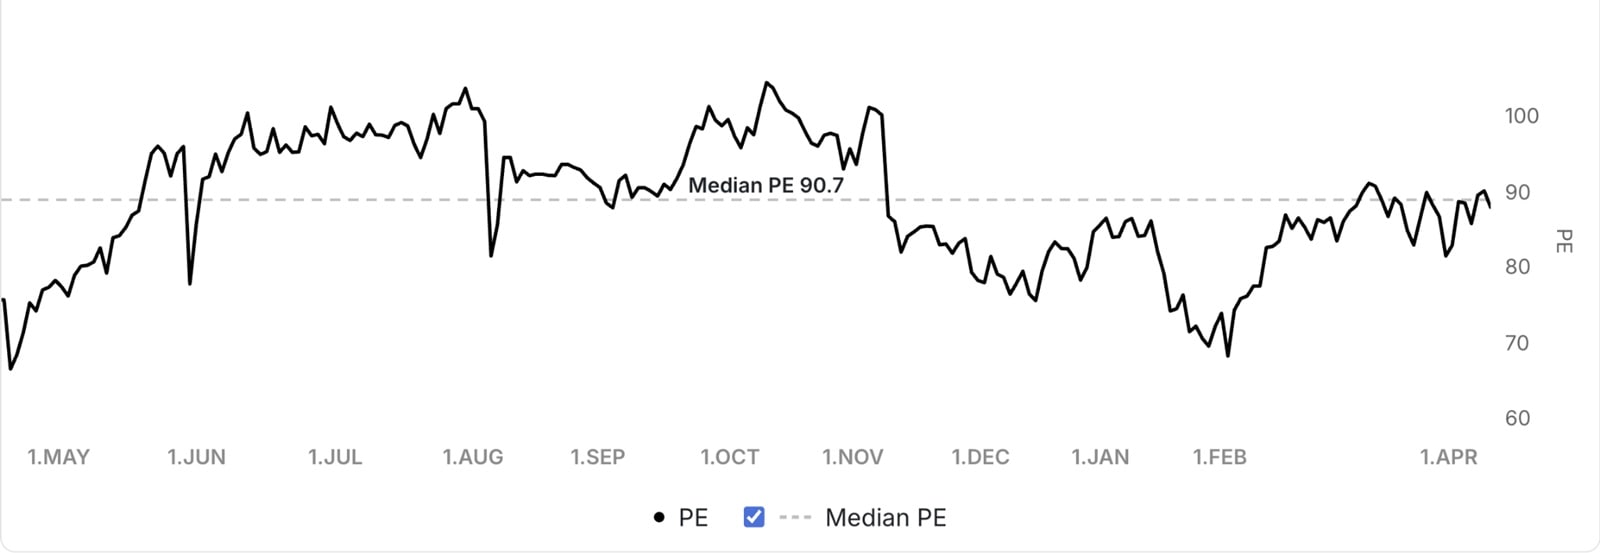 (Source: http://www.tijorifinance.com)
This places it firmly in line with peers like Hitachi Energy India, ABB India and Siemens India.
The bull case is straightforward.
Story continues below this ad
If revenue grows at 25-30% annually and EBITDA margins sustain at 22-25%, FY28 PAT could be in the range of Rs 1,500-1,900 crore. At that point, the current market cap of Rs 94,000 crore implies a forward PE of 49-63x on FY28 earnings. For a company growing at this pace, that is more palatable.
The risk is slowdown in growth, heightened competition from Chinese players, and project execution delays.
At 85x earnings, GE Vernova T&D India is not cheap by any conventional metric. But conventional metrics often fail at inflection points. The forward math (49-63x on FY28 estimates) is still more palatable if the growth trajectory holds.
The next four to six quarters will tell us whether 85x is the price of admission to a structural growth story, or the price of a cycle that’s already priced in.
Note: We have relied on data from http://www.Screener.in and http://www.tijorifinance.com throughout this article. Only in cases where the data was not available, have we used an alternate, but widely used and accepted source of information.
Rahul Rao has helped conduct financial literacy programmes for over 1,50,000 investors. He also worked at an AIF, focusing on small and mid-cap opportunities.
Disclosure: The writer or his dependents do not hold shares in the securities/stocks/bonds discussed in the article.
The website managers, its employee(s), and contributors/writers/authors of articles have or may have an outstanding buy or sell position or holding in the securities, options on securities or other related investments of issuers and/or companies discussed therein. The content of the articles and the interpretation of data are solely the personal views of the contributors/writers/authors. Investors must make their own investment decisions based on their specific objectives, resources and only after consulting such independent advisors as may be necessary.